Published on
By Lauren Hines | Bond LSC
The brain is a unique challenge. It has billions of cells with billions of different functions, making it hard to understand what is going on underneath. MU cores now offer 10X Genomics Visium technology which allows researchers to lay genetic data over an image of a tissue sample creating a map of the brain at a genetic level — or any other organ you can think of.
“Spatial transcriptomics is a great example of how science has become more collaborative in nature, certainly, and that requires cross-disciplinary interaction between researchers and other technologies,” said Nathan Bivens, director of the Genomics Technology Core at Bond LSC.
Teamed up with the Advanced Light Microscopy Core and Bioinformatics and Analytics Core, Bivens’s core played a key part in developing spatial sequencing on campus. The technique maps physical characteristics of any tissue to its corresponding gene expression, so researchers can understand what’s going on at the genetic level.
The collaboration started last year when researchers across the country reached out to the individual directors at Bond LSC. Each could handle their part of the project but realized they couldn’t do it alone.
“There are very few places that have all three of those groups, especially in one building where they work so closely together,” said Lyndon Coghill, director of the Bioinformatics and Analytics Core.
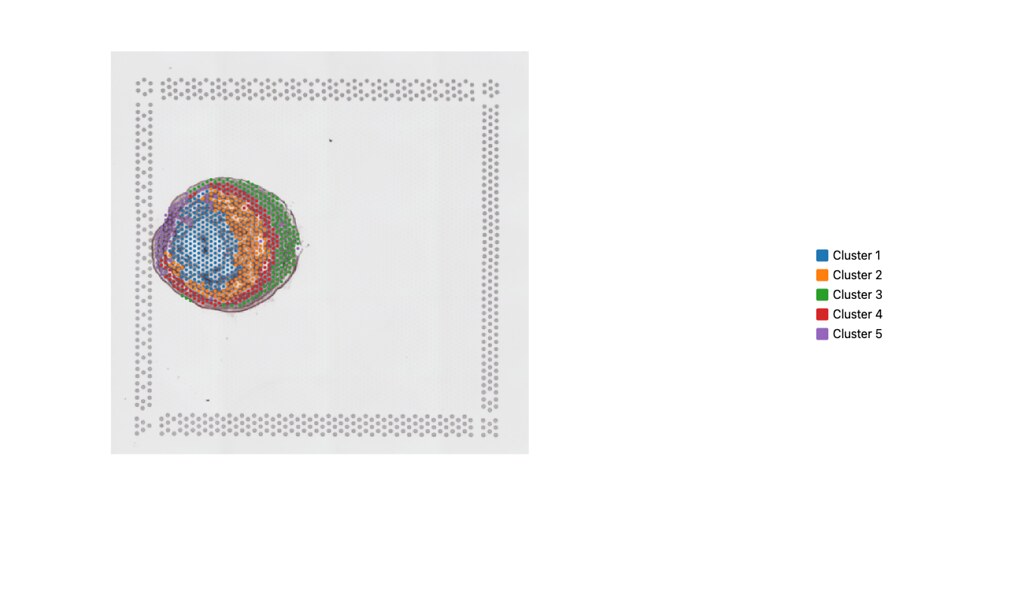
Spatial sequencing provides scientists with a way to point at tissue and say where which gene is being expressed and identify cell types. Researchers can understand how these cells are interacting with each other and what that means for the function of the organ overall.
“We can actually see which part of that tissue those differences are occurring in, which can dramatically increase our biological understanding of what’s happening because certain types of tissues are known to do certain things biologically. By connecting those pieces, it’s sort of like adding that final puzzle piece to getting a full picture of what’s happening between these things,” Coghill said.
Before spatial sequencing, there were a few ways to analyze the genes in tissues, but no real way to see what traits those genes were connected to or how these genes were interacting with each other.
While tissues have different cell layers and a lot going on, researchers would have to mix that all up kind of like using a blender. Take a simple leaf for example. It would be ground up with mortar and pestle then put in a solution to be sequenced. By analyzing the mixture, they could see all the genes together, but lose definition and cell-specific expression of genes. Essentially, it created a genetic average of everything, and you couldn’t see how genes were expressed closer to the stem versus farther away or in a specific structure.
“Spatial transcriptomics is just the right approach to study gene expression inside diverse cell populations like the brain or small brain regions,” said Alexander Jurkevich, associate director of the Advanced Light Microscopy Core. “It really opens great perspectives for studying, knowing and learning new functions.”
The key to this technology is having equipment and expertise for imaging, DNA analysis and data organization all under one roof.
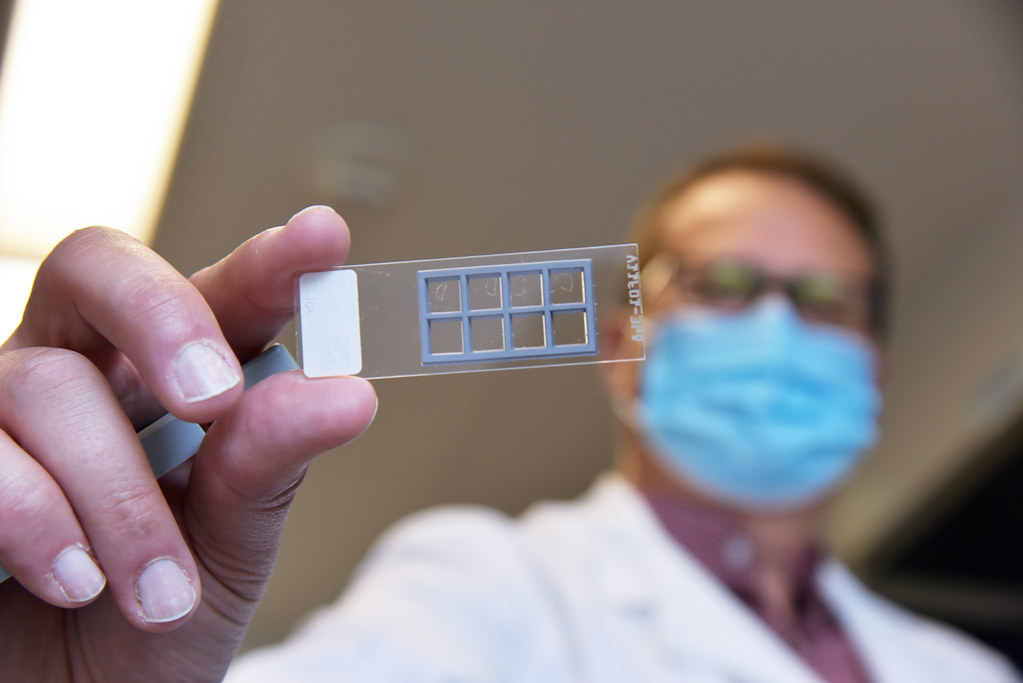
The process starts in the Advanced Light Microscopy Core where Jurkevich thinly slices frozen tissue, puts these slices onto very special slides and stains it with a dye so it can show up underneath the microscope. After taking some pictures, it gets sent off to Bivens in the Genomics Technology Core.
Core staff then enzymatically removes the cell membranes of the tissue to release genetic material. Remember those special slides? Even though the tissue is now broken down, those slides have dots underneath the tissue that capture the expressed genes and assign a unique barcode to each point of the tissue. That way, researchers can analyze the data but still know which gene goes where.
Finally, all this data — from the DNA analysis, the images and the barcodes — all go to Coghill in the Bioinformatics and Analytics Core. Coghill and his team work to organize the data and create a map of the tissue and its genetics.
Jurkevich, Bivens and Coghill are looking towards seeing this technology map tumor treatment, Alzheimer’s in the brain and other disease studies.
“I really do think this connection of the raw data with a biological architecture is where we’re going to make those kinds of leaps forward not just in discovery, but also in potential clinical applications,” Coghill said.
Now, the cores have finished their first attempt at this huge collaboration. So far, it’s been successful, but they want to streamline the process. The biggest hurdle has been finding times when all three cores are available to work on a new project.
“Working on this technology was a great opportunity to work with different research cores … for us to learn something new and generate a product which is unique and very complex,” Jurkevich said.
Spatially resolved transcriptomics technology was declared as the Method of the Year 2020 by the Nature Methods journal.